Visual Studio Tips - Using Data Tips
April 1, 2019 in VSTipsData tips, the Visual Studio feature that allows you to hover over a variable and see its value while debugging, can be super useful. Here are a few tricks that you may not know about them.
Have you ever been looking in the DataTips then need to look at the code behind them? Great news, you can. Just press and hold Ctrl key, the DataTips become transparent until you release the Ctrl key. This is particularly useful when you’ve drilled down a bit in the DataTip or you’re trying to compare
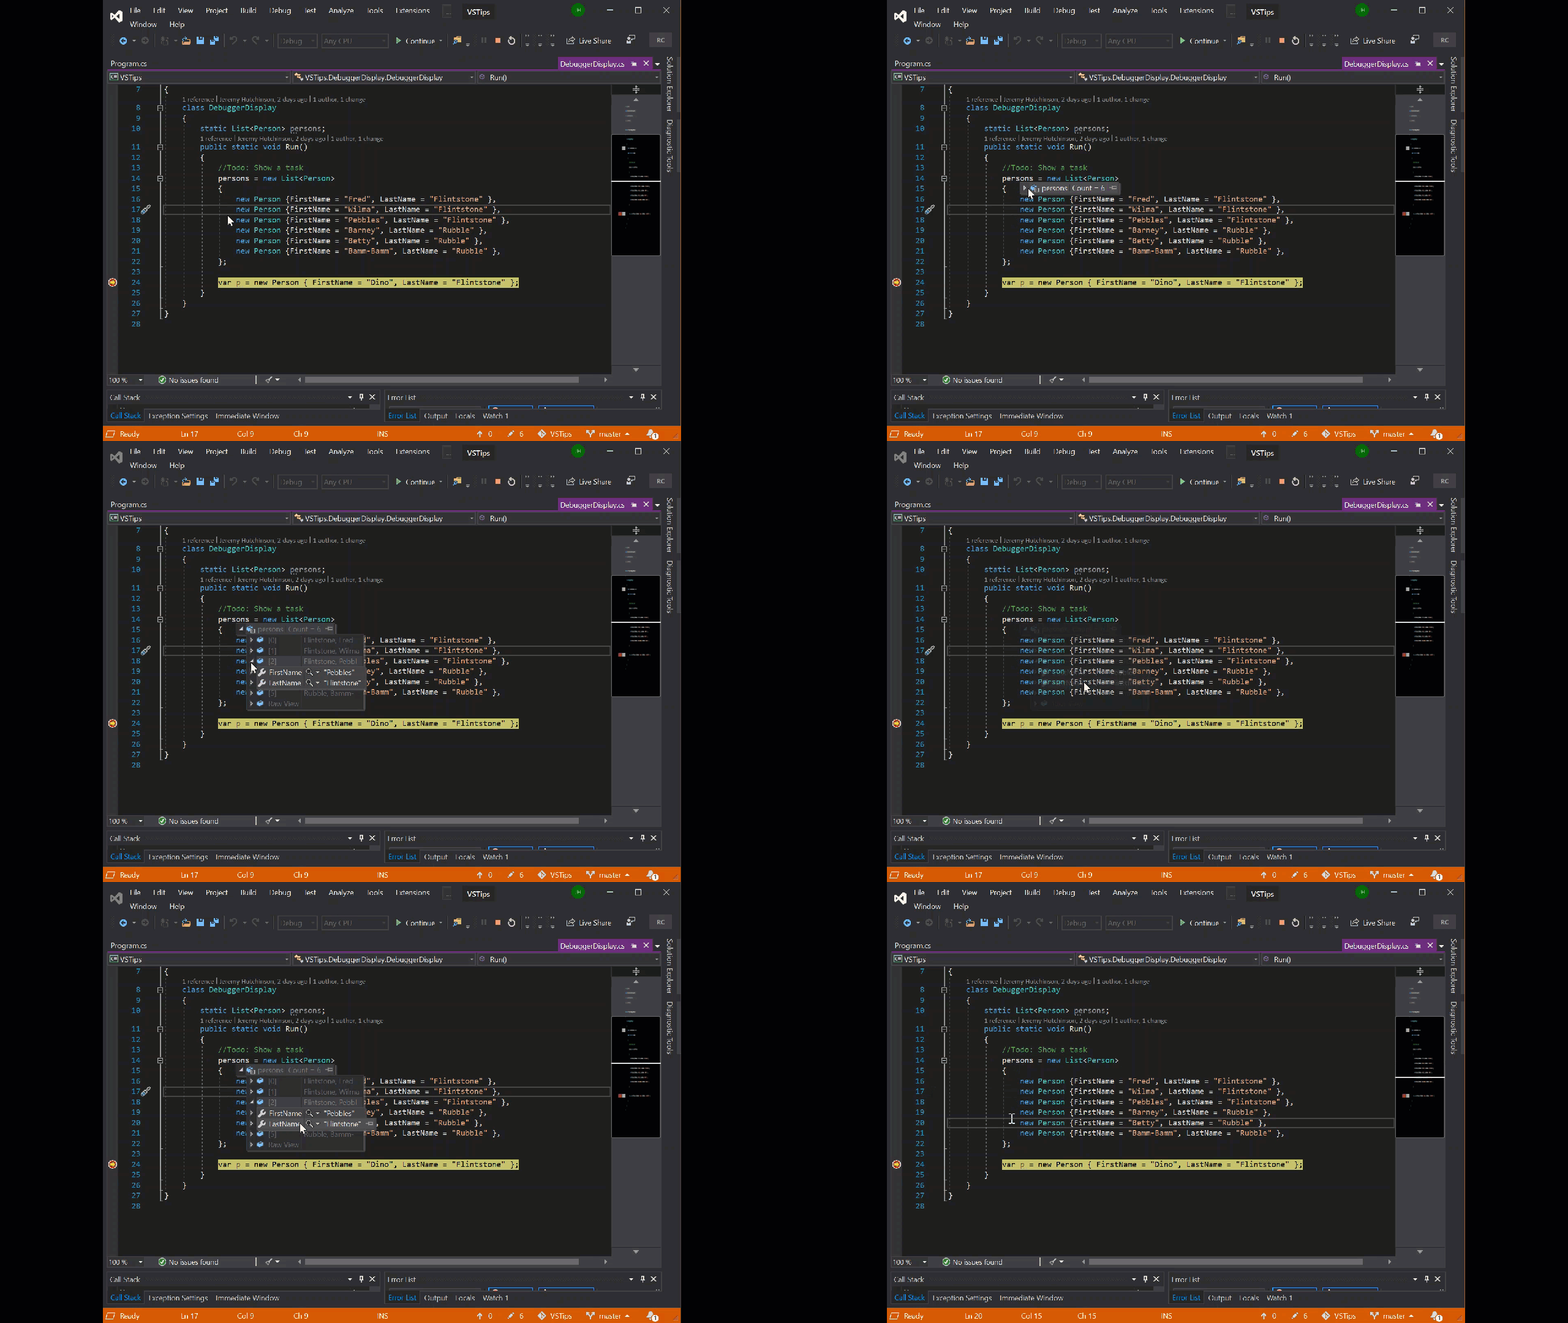
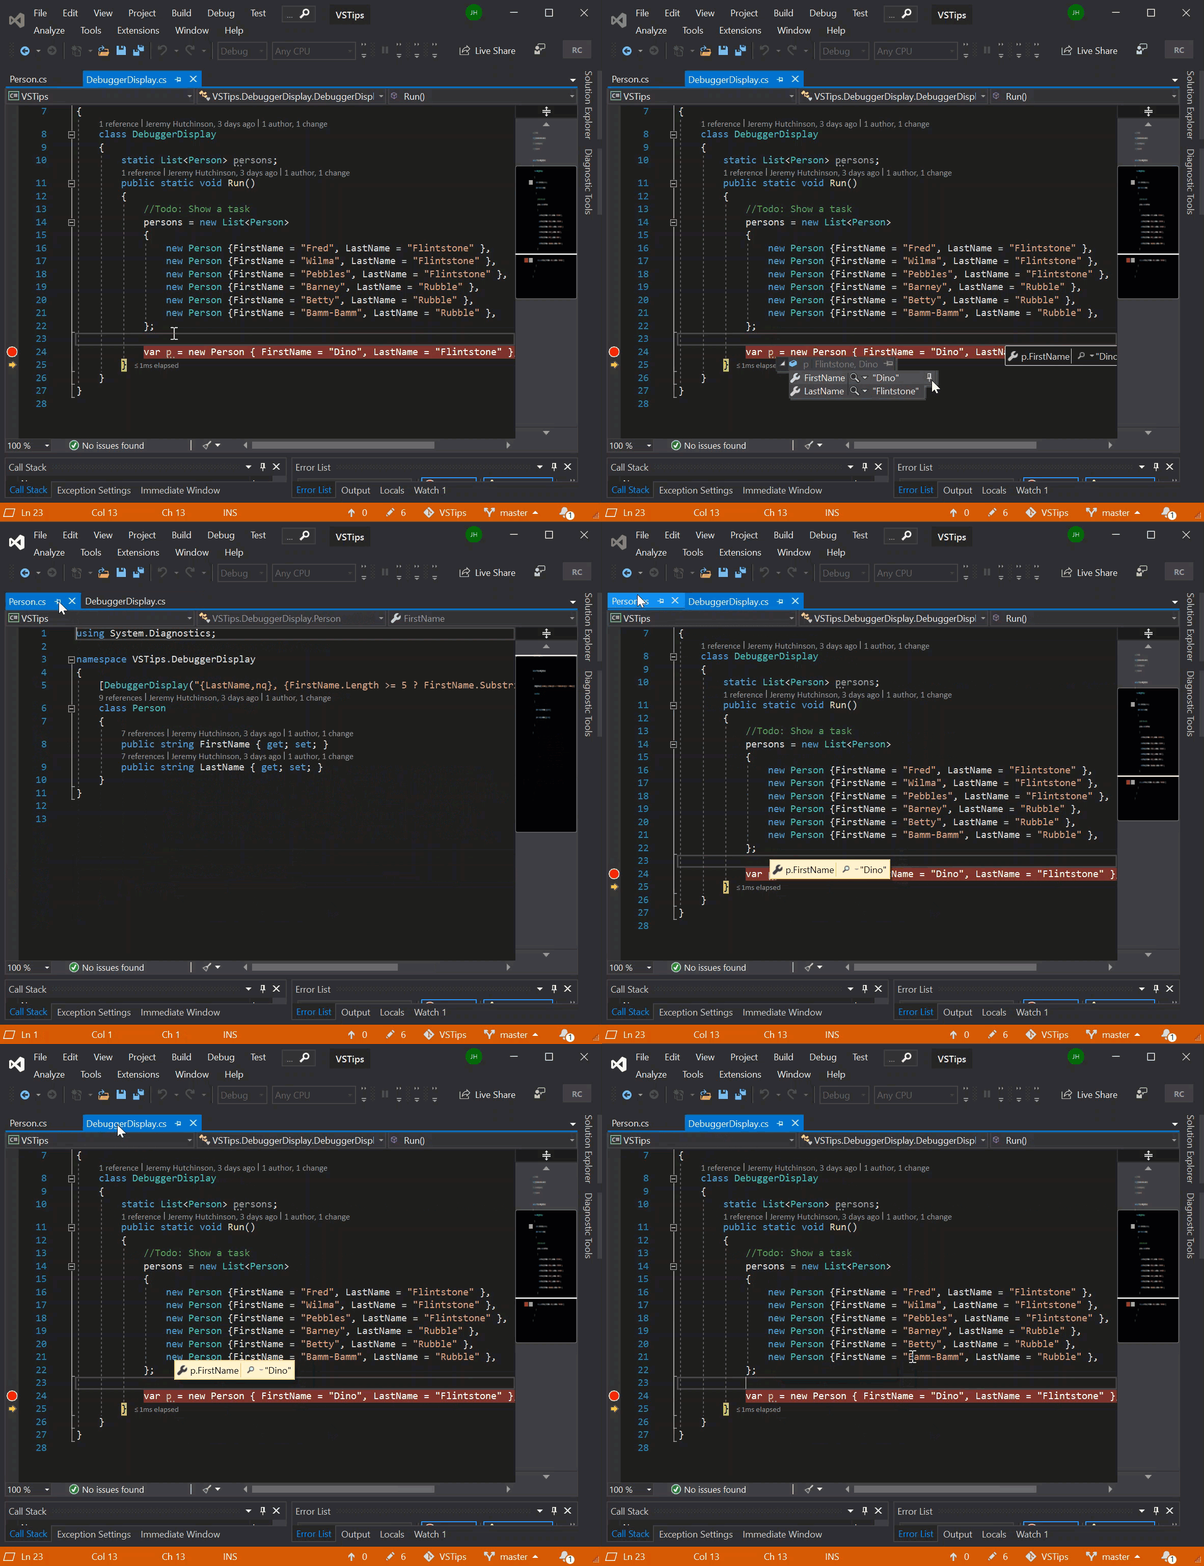
Another thing you can do is either pin the DataTips. This persists the DataTip so you can navigate to other code, restart debugging or even restart Visual Studio and still have the DataTip be there when you break in that block the next time. Once you’ve pinned a DataTip you can move the data tip around by clicking and dragging, you can remove it by clicking the x, or you can float the DataTip by clicking the pin icon. This allows you to view that DataTip while you scroll the code or view another file.
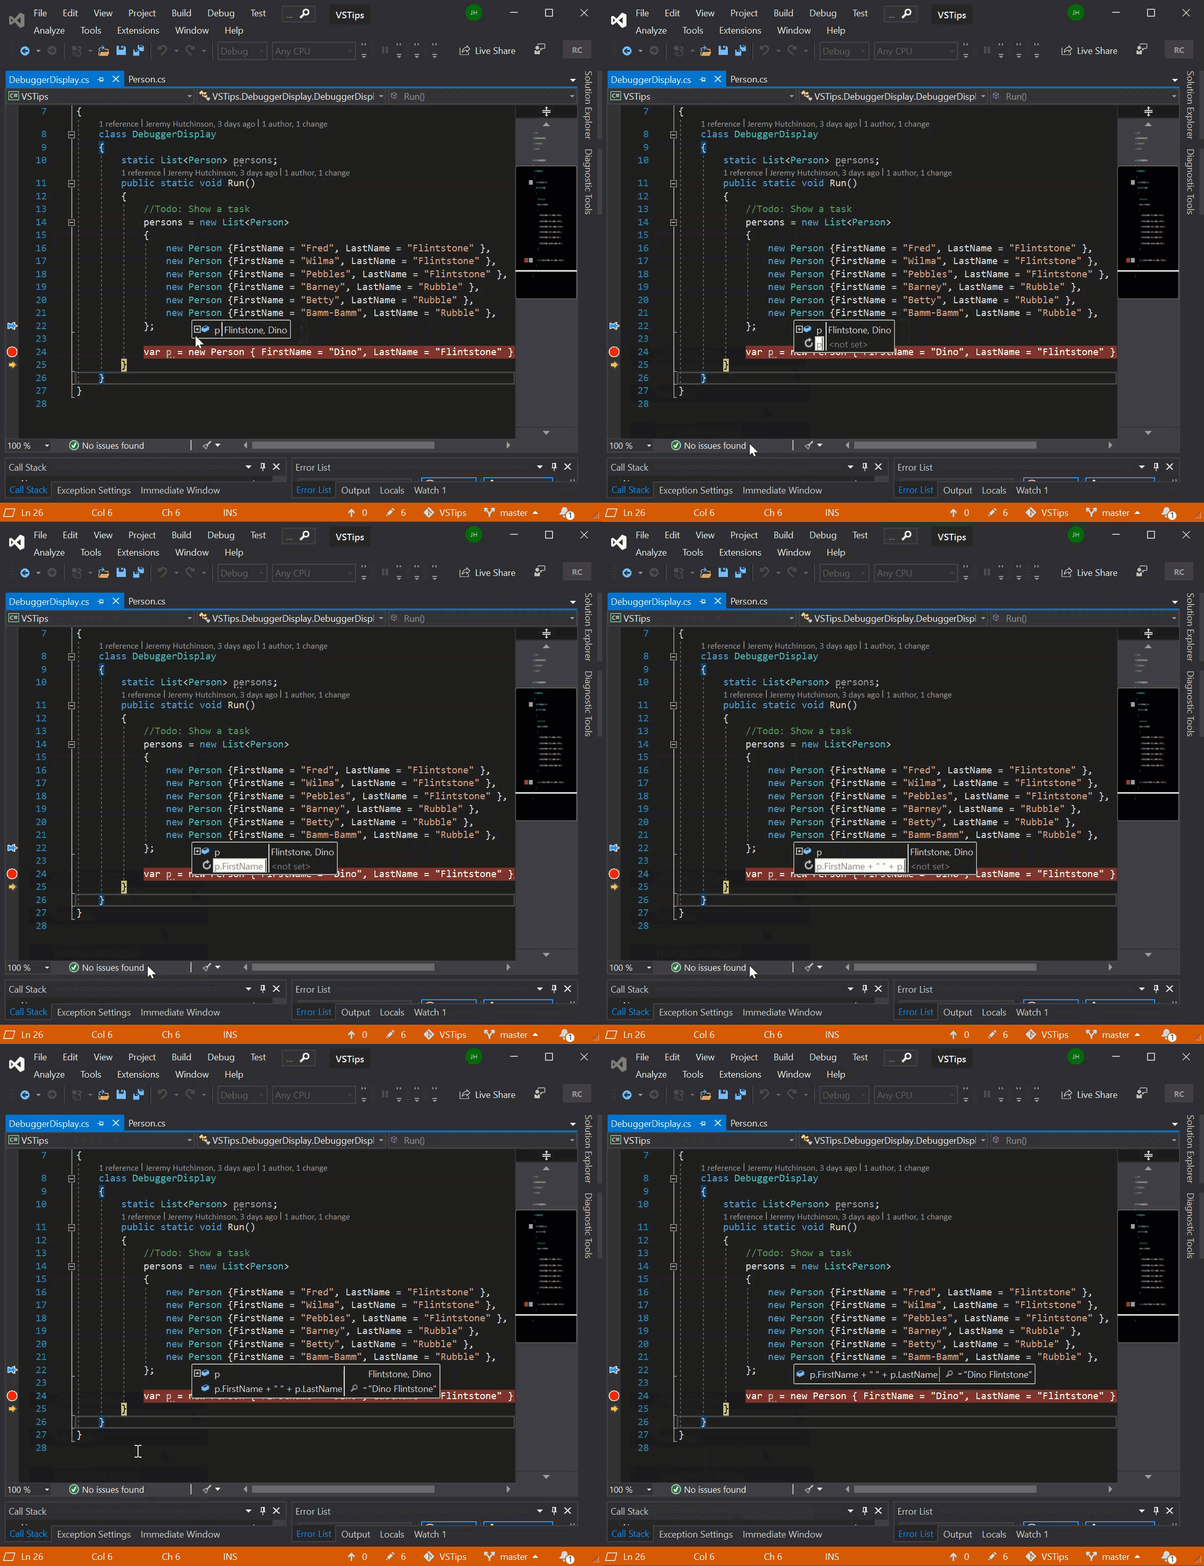
Once you’ve pinned a DataTip, you can add expressions to that DataTip by right-clicking on the DataTip and choosing “Add Expression”. This can let you pin something more useful than what might normally display for an object. In this case, the DebuggerDisplay shows LastName, FirstName, but we can add an expression to display the Person object as FirstName LastName. This is really handy for when you can’t change the DebuggerDisplay of an object.
The other interesting feature of DataTips is that you can add comments to them.
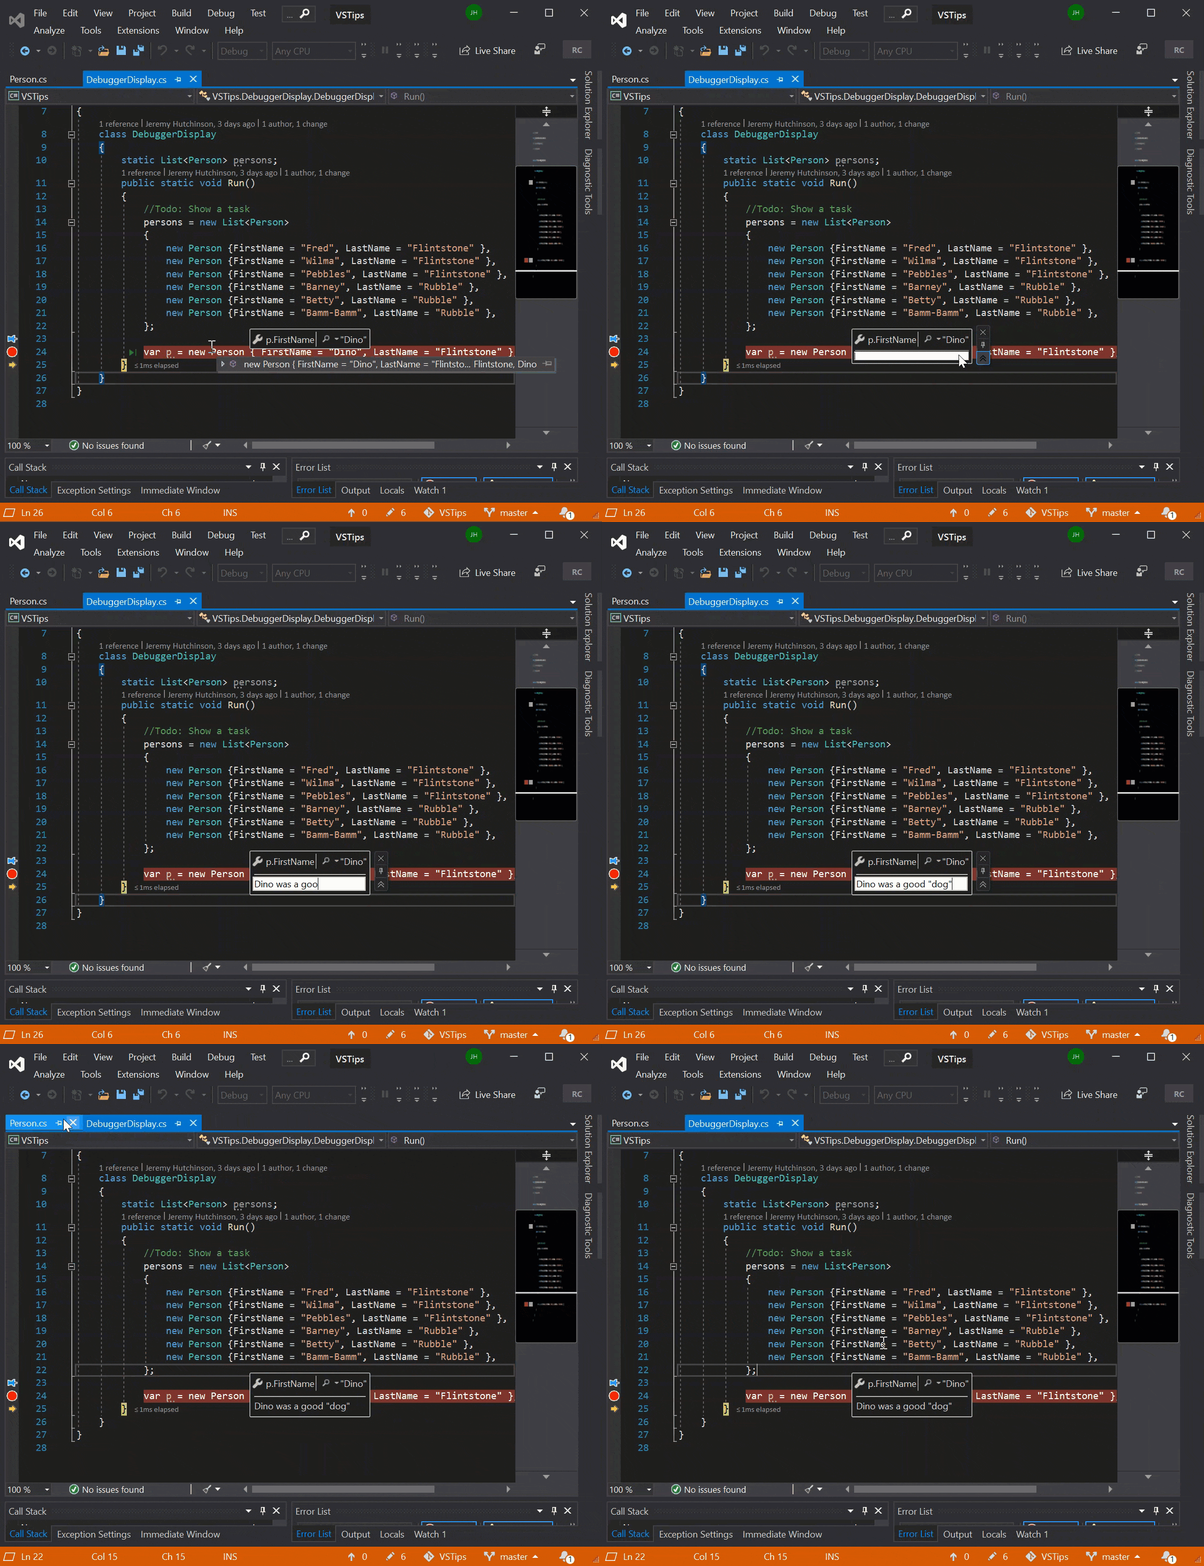
But what good are comments if you can’t share them? Well, you can export your DataTips to an XML file and either share them or check them in with your source. You could have a set of DataTips that you load up whenever you’re facing a common debugging scenario.
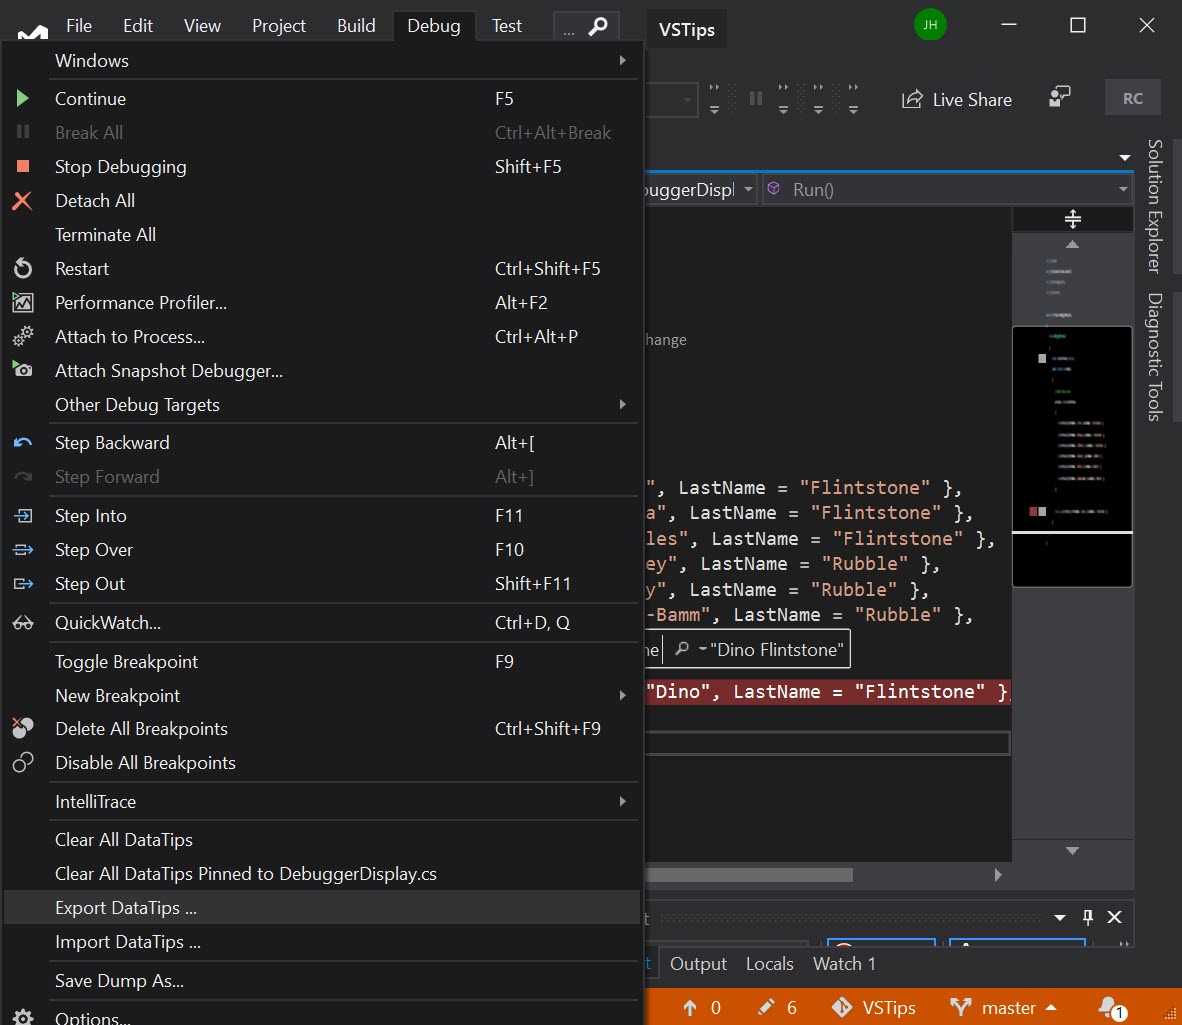
You might also notice there are options in there to “Clear All DataTips”, and “Clear All DataTips from [CurrentFileName]”.
Have a comment or suggestion? This blog takes pull requests.Or you can just open an issue.